The National Association of REALTORS® surveyed their members for their Confidence Index.
The REALTORS® Confidence Index is a key indicator of housing market strength based on a monthly survey sent to over 50,000 real estate practitioners. Practitioners are asked about their expectations for home sales, prices and market conditions.
Homes sold in less than 60 days in 44 out of 50 states, and Washington D.C.
Homes typically went under contract in 34 days in October!
There are many unsubstantiated theories as to why home values are continuing to increase. From those who are worried that lending standards are again becoming too lenient (data shows this is untrue), to those who are concerned that prices are again approaching boom peaks because of “irrational exuberance”(this is also untrue as prices are not at peak levels when they are adjusted for inflation), there seems to be no shortage of opinion.
However, the increase in prices is easily explained by the theory of supply & demand. Whenever there is a limited supply of an item that is in high demand, prices increase.
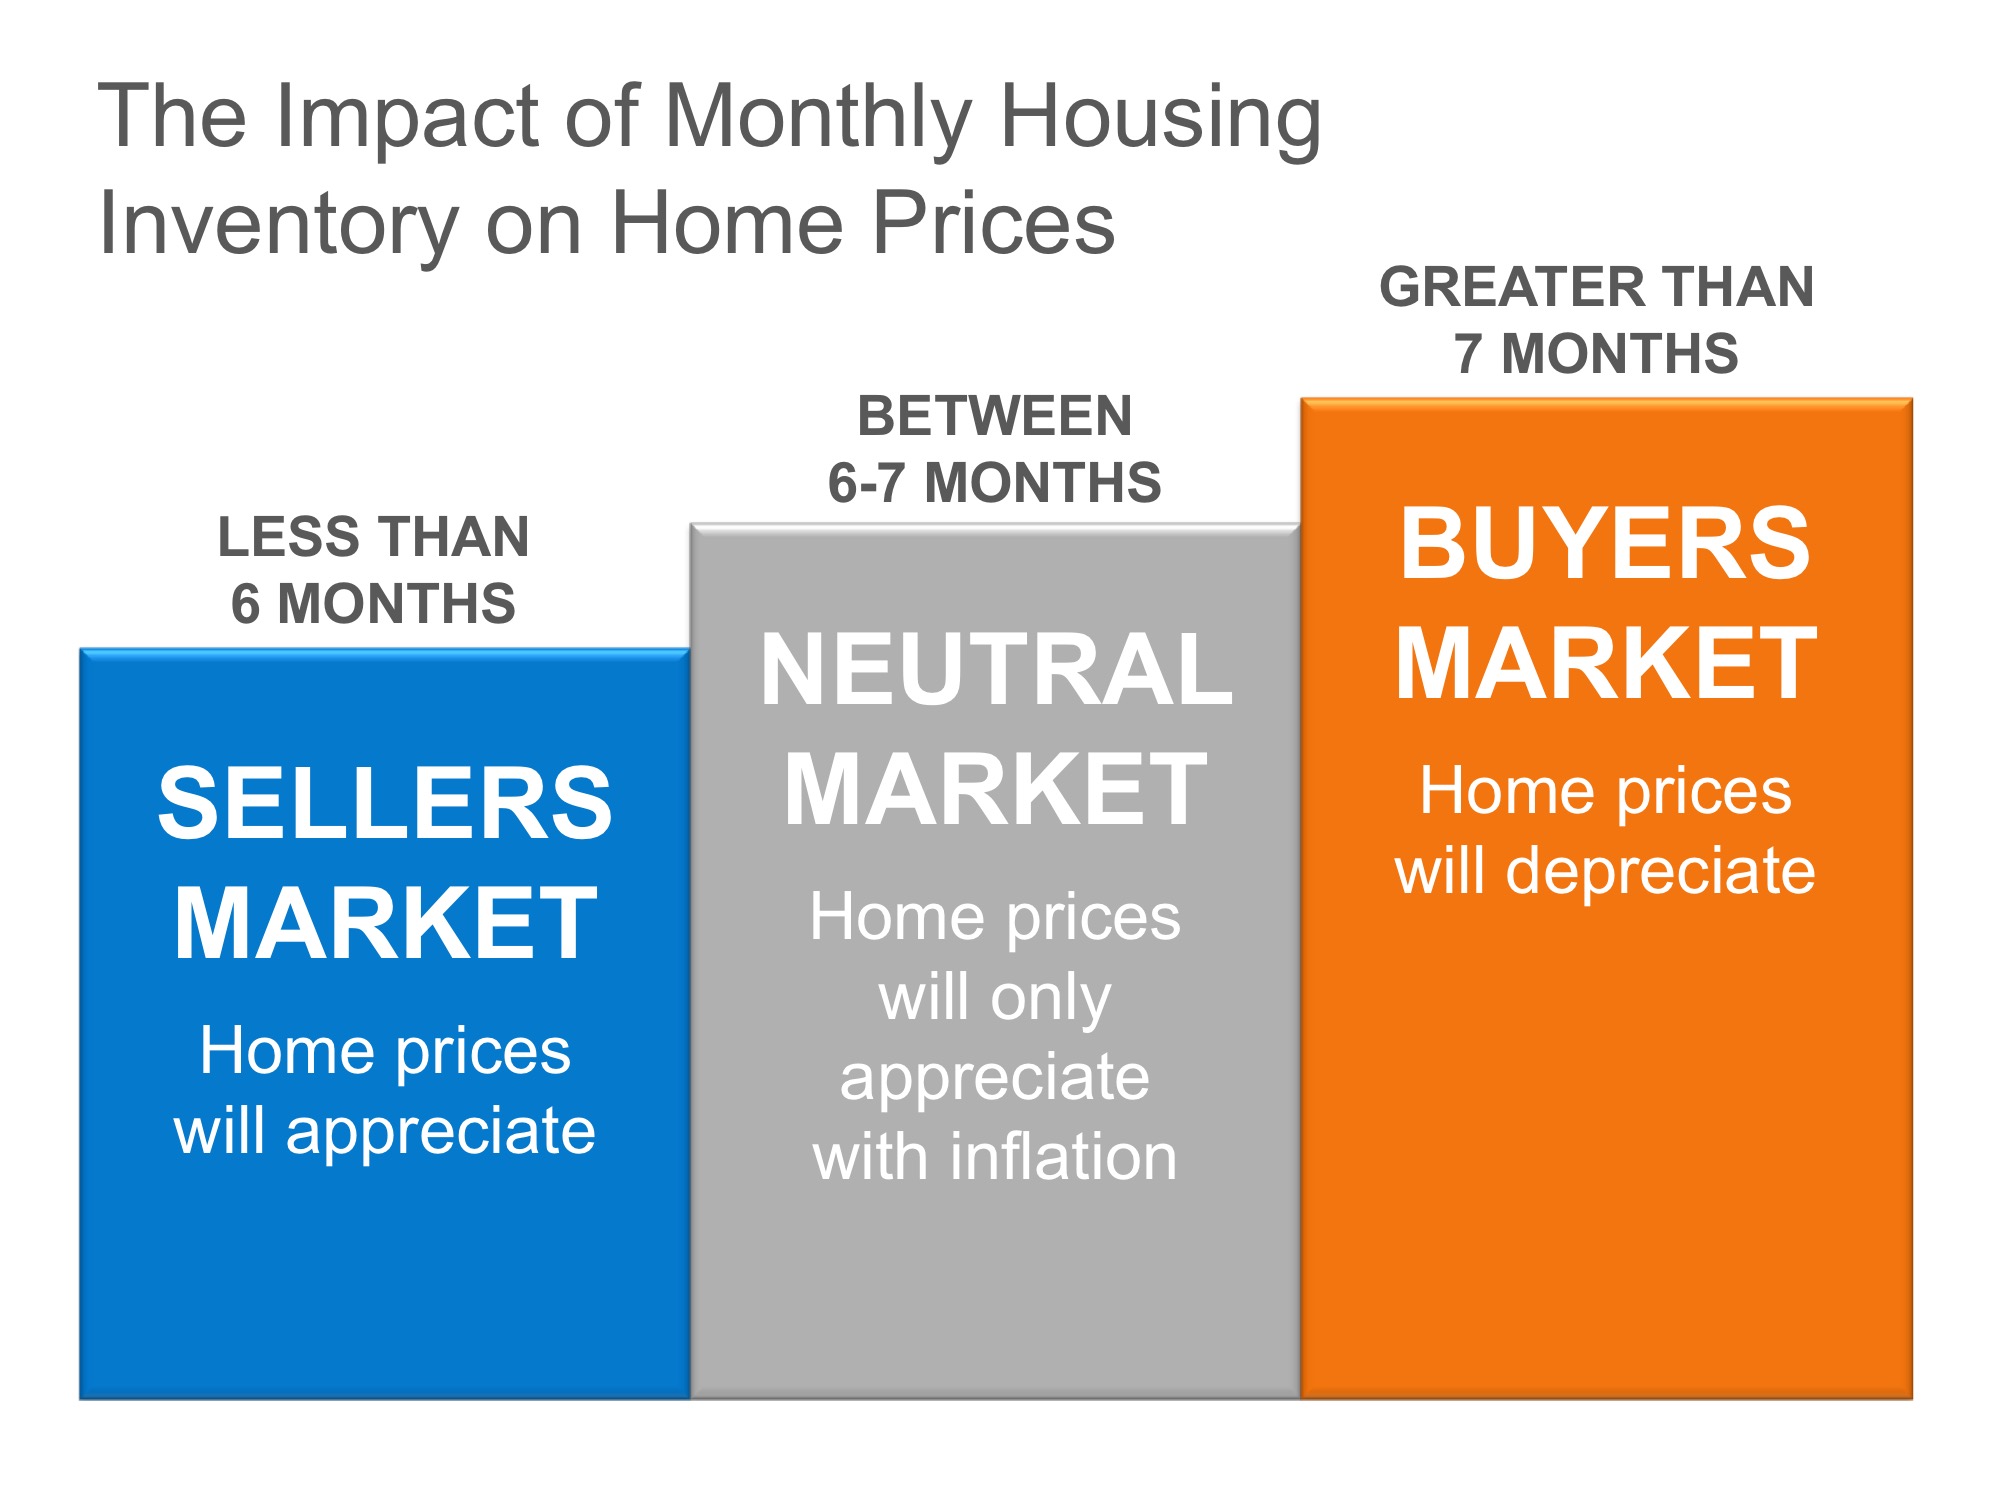
It is that simple. In real estate, it takes a six-month supply of existing salable inventory to maintain pricing stability. In most housing markets, anything less than six months will cause home values to appreciate and anything more than seven months will cause prices to depreciate (see chart 1).
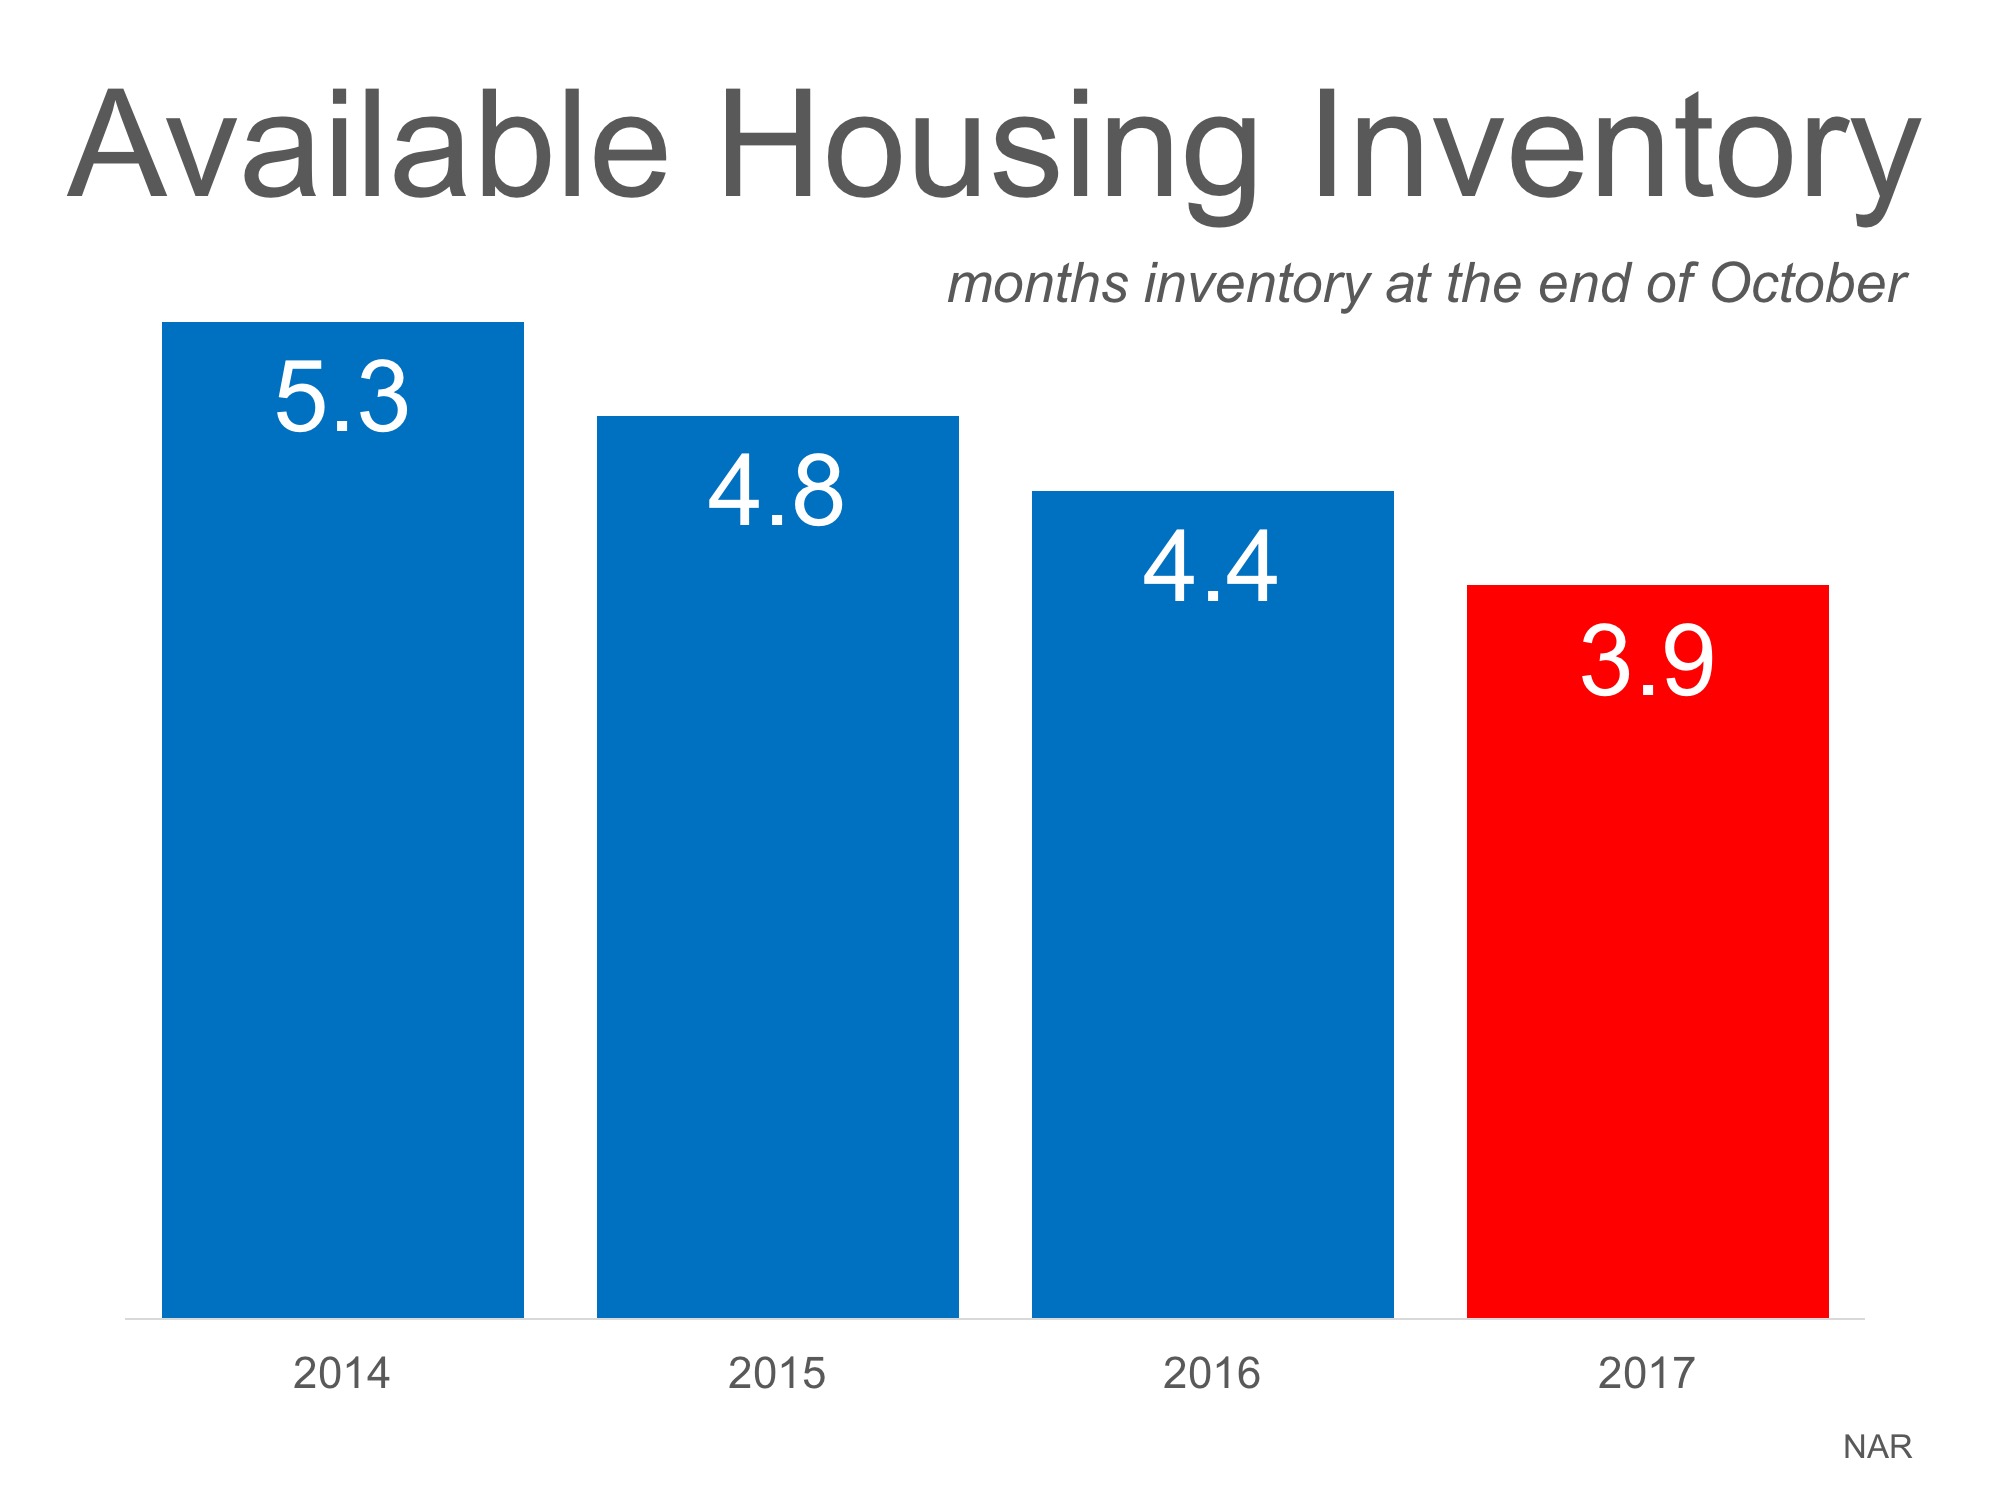
According to the Existing Home Sales Report from the National Association of Realtors (NAR), the monthly inventory of homes has been below six months for the last four years (see chart 2).
Bottom Line
If buyer demand outpaces the current supply of existing homes for sale, prices will continue to appreciate. Nothing nefarious is taking place. It is simply the theory of supply & demand working as it should.
There is a lot of discussion about the current state of housing affordability for both first-time and move-up buyers, and much of the narrative is tarnished with a negative slant. However, the truth is that housing affordability is better today than at almost any time in our history.
The naysayers are correct in the fact that affordability today is not as good as it has been over the last several years. But, we must remember that home prices collapsed during the housing crash, and distressed properties (foreclosures and short sales) kept home values depressed for years. When we compare affordability to the decades that proceeded the crash, a different story is revealed.
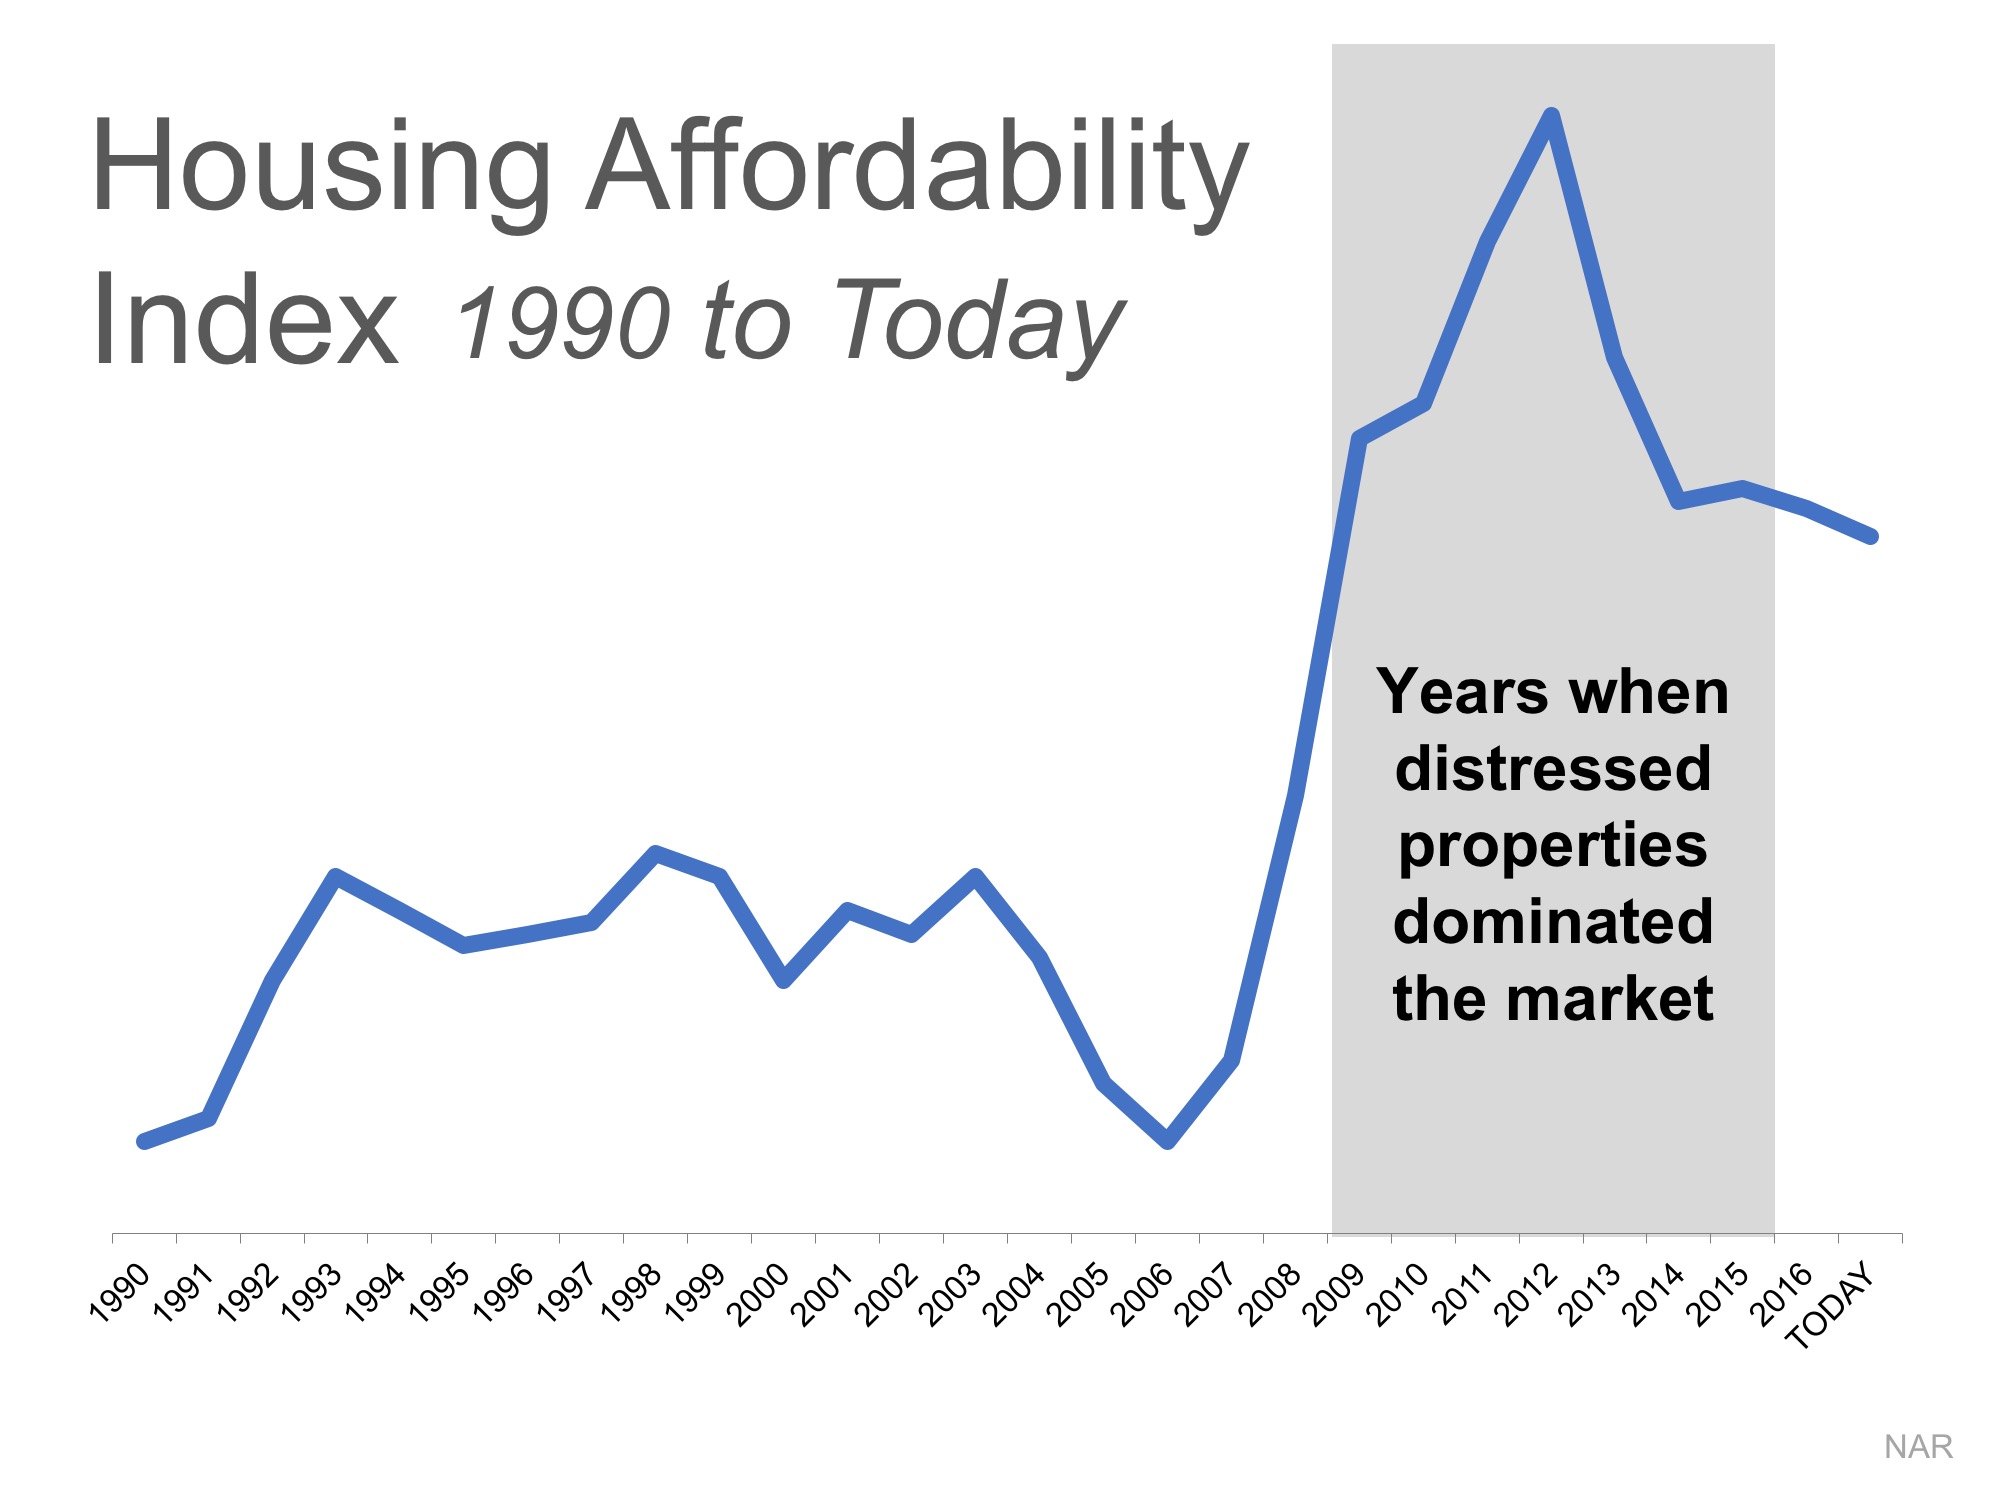
Here is a graph of the National Association of Realtors’ Housing Affordability Index. The higher the graph, the more affordable homes are.
We can see that affordability is better today than in the fifteen years prior to the boom and bust.
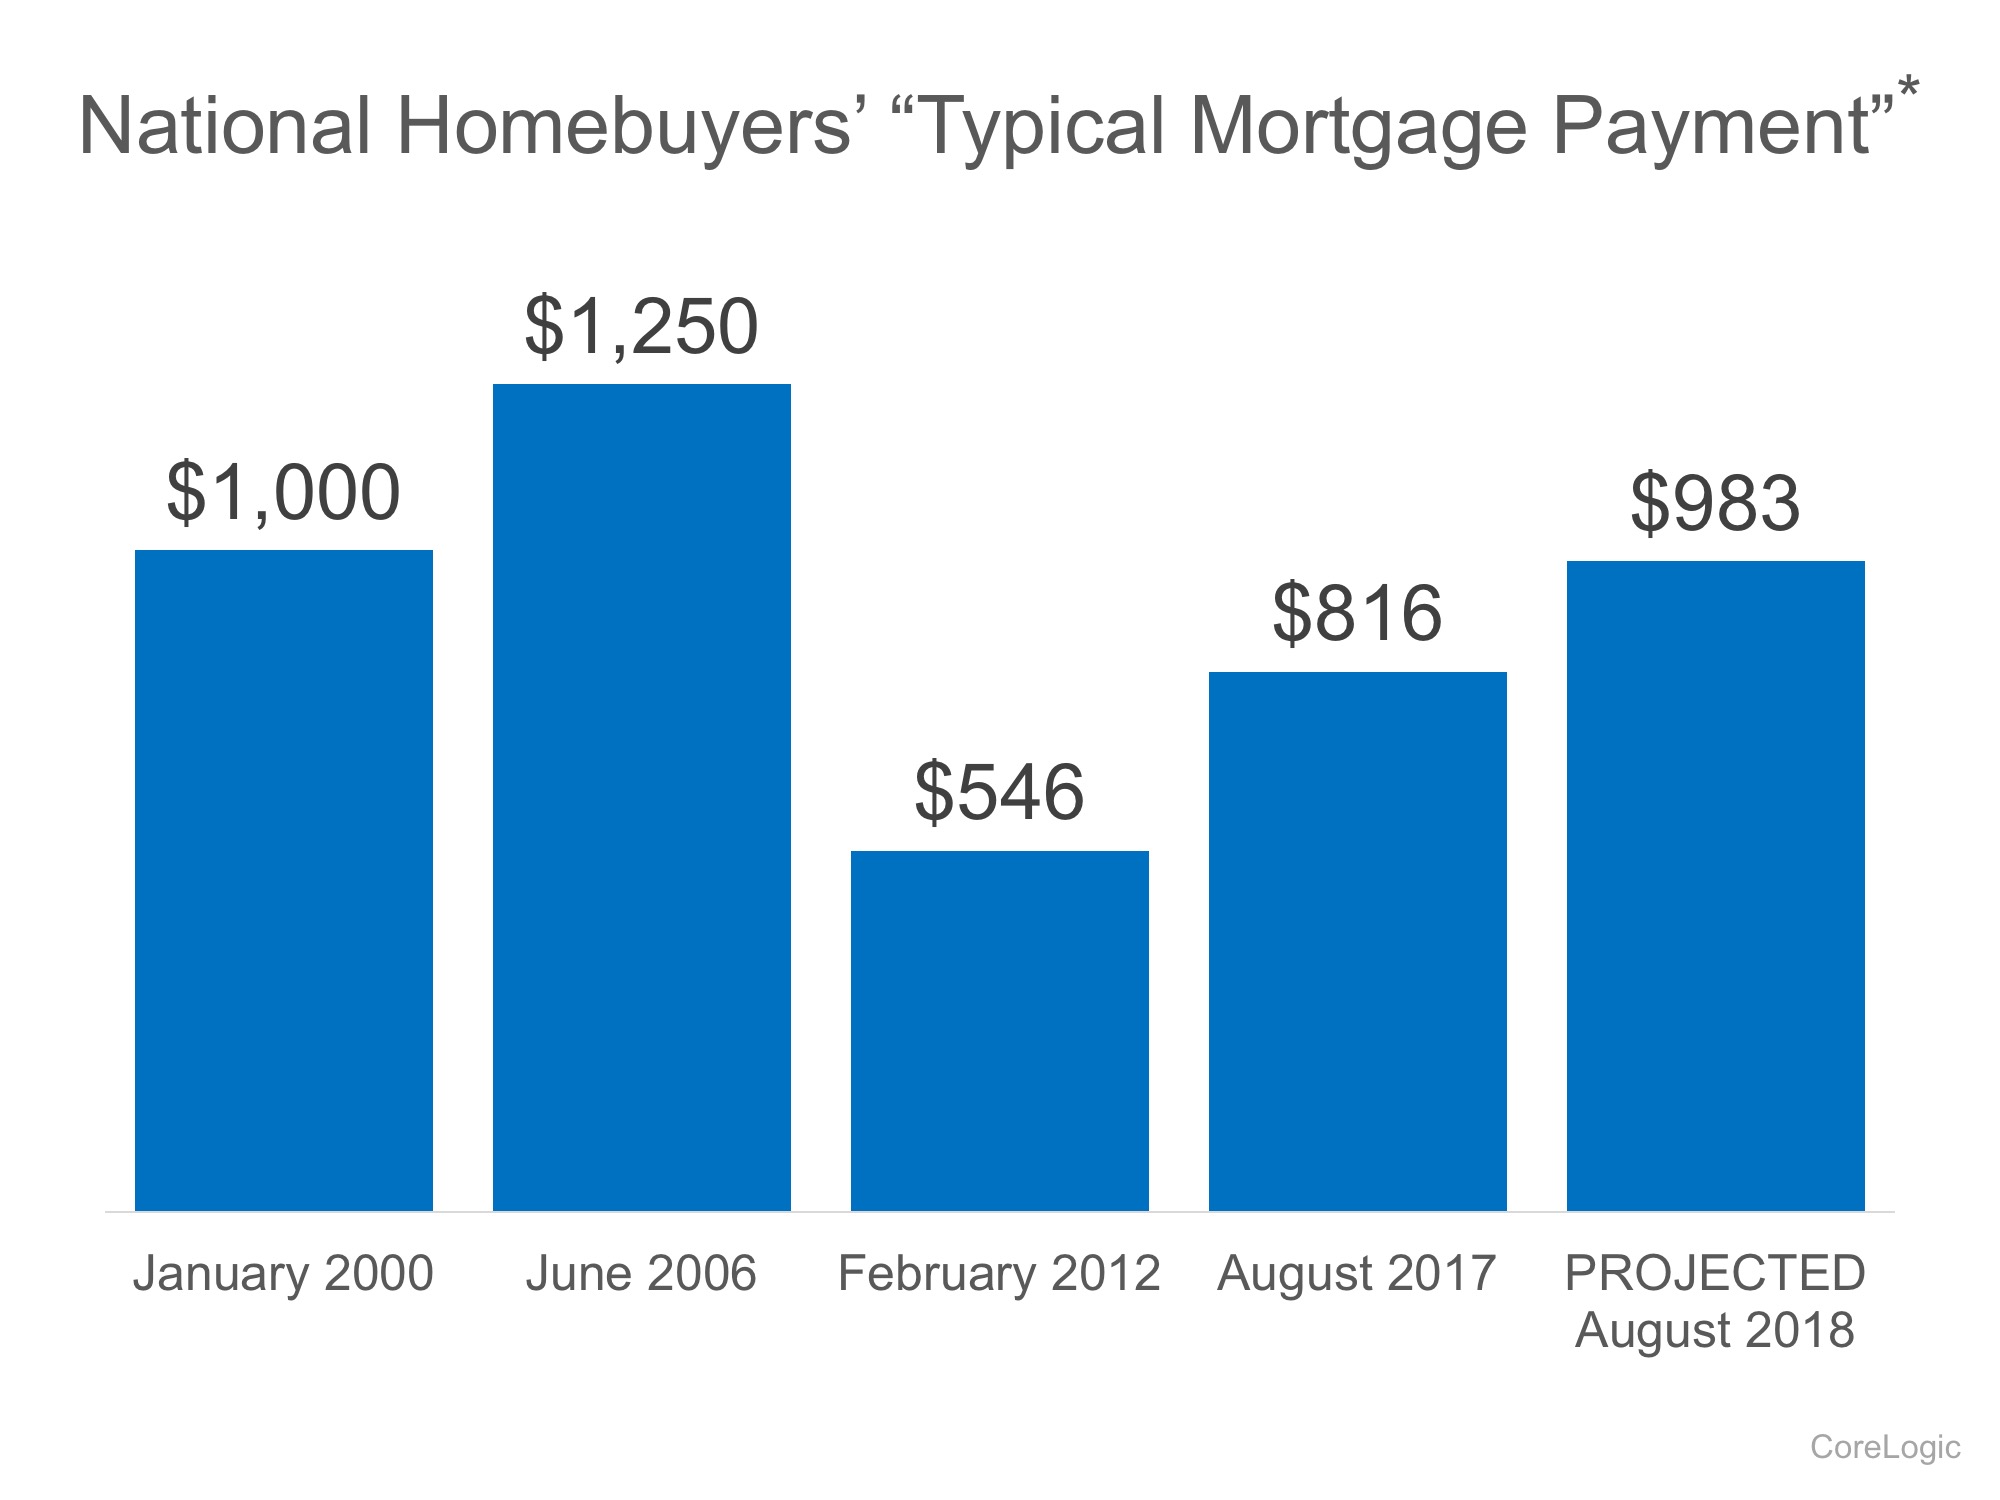
It reveals that, though a ‘typical’ housing payment was less expensive in 2012 (remember distressed properties), it is currently less expensive than it was in 2000 and is still projected to be lower next year than it was in 2000.
Bottom Line
Mark Fleming, Chief Economist at First American, explained it best:
“While borrowing power for the potential home buyer has fallen relative to the low point of 2012, it remains high today and will remain high next year, relative to the long run average. If you don’t want to rent anymore and are considering becoming a homeowner, even if mortgage rates rise next year, your borrowing power will remain strong by historic standards.”
According to Freddie Mac’s latest Primary Mortgage Market Survey, interest rates for a 30-year fixed rate mortgage are currently at 3.92%, which is still near record lows in comparison to recent history!
The interest rate you secure when buying a home not only greatly impacts your monthly housing costs, but also impacts your purchasing power.
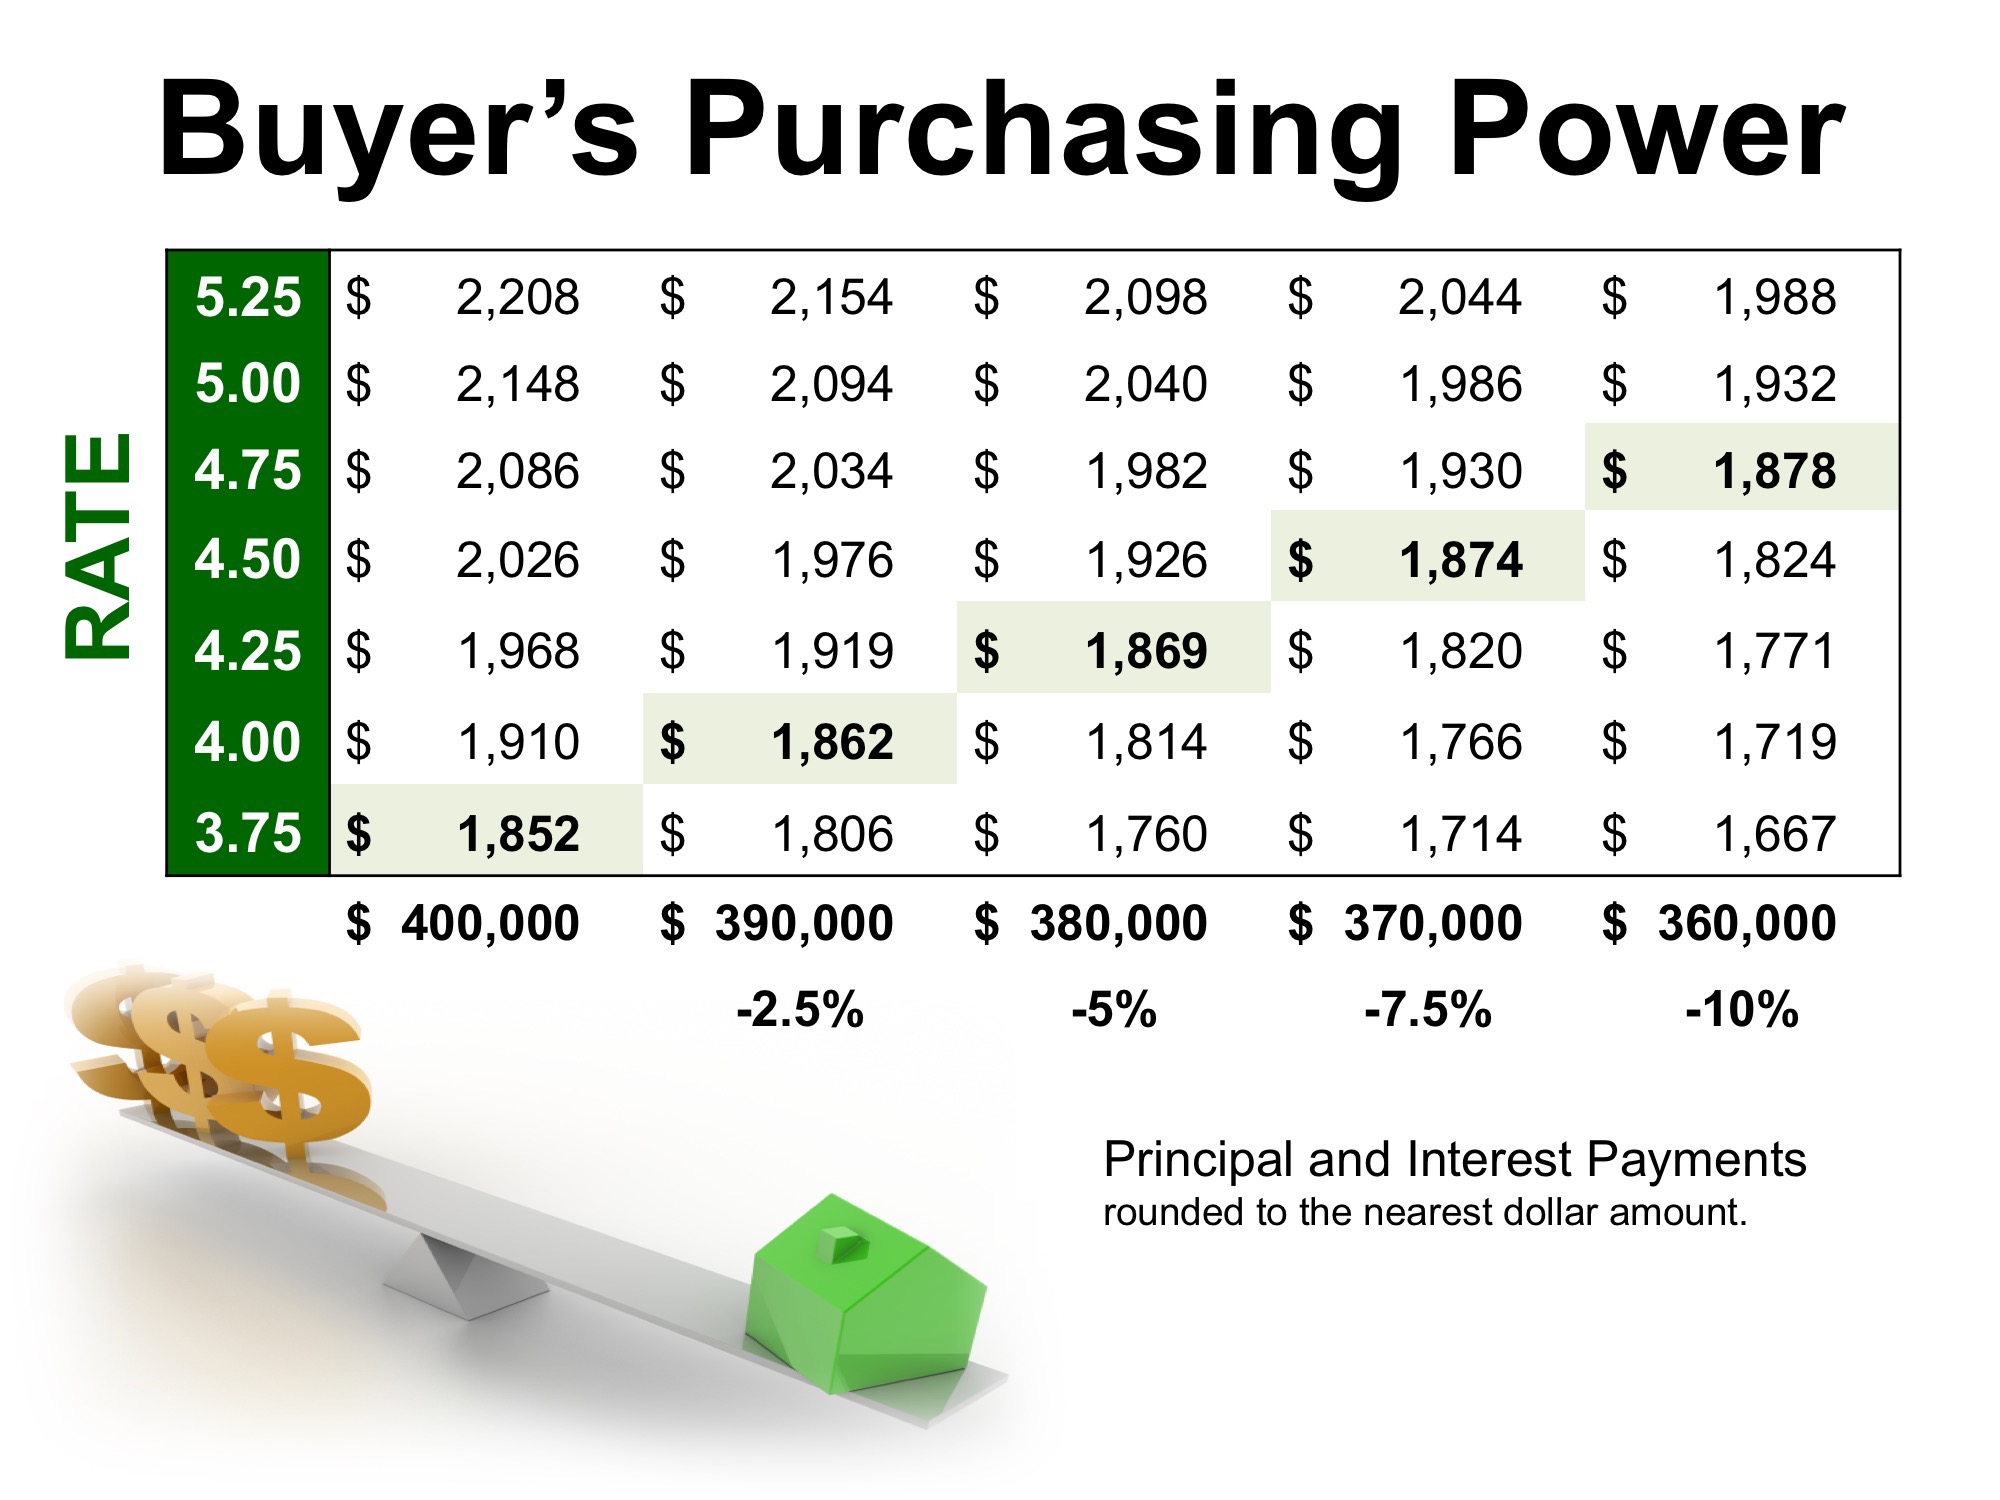
Purchasing power, simply put, is the amount of home you can afford to buy for the budget you have available to spend. As rates increase, the price of the house you can afford will decrease if you plan to stay within a certain monthly housing budget.
The chart below shows what impact rising interest rates would have if you planned to purchase a home within the national median price range, and planned to keep your principal and interest payments between $1,850-$1,900 a month.
With each quarter of a percent increase in interest rate, the value of the home you can afford decreases by 2.5% (in this example, $10,000). Experts predict that mortgage rates will be closer to 5% by this time next year.
Act now to get the most house for your hard-earned money.
Owning a home has great financial benefits, yet many continue to rent! Today, let’s look at the financial reasons why owning a home of your own has been a part of the American Dream for as long as America has existed.
“In reality, buying or renting a home is an intensely personal decision, with emotional and even financial considerations that go beyond whether to invest in this one (admittedly large) asset. Looking strictly at housing market numbers, there is a concrete point at which buying a home makes more financial sense than renting it.”
What proof exists that owning is financially better than renting?
1. We recently highlighted the top 5 financial benefits of homeownership:
Homeownership is a form of forced savings.
Homeownership provides tax savings.
Homeownership allows you to lock in your monthly housing cost.
Buying a home is cheaper than renting.
No other investment lets you live inside of it.
2. Studies have shown that a homeowner’s net worth is 44x greater than that of a renter.
3. Just a few months ago, we explained that a family that purchased an average-priced home at the beginning of 2017 could build more than $48,000 in family wealth over the next five years.
4. Some argue that renting eliminates the cost of taxes and home repairs, but every potential renter must realize that all the expenses the landlord incurs are already baked into the rent payment– along with a profit margin!!
Bottom Line
Owning a home has always been, and will always be, better from a financial standpoint than renting.
The inventory of existing homes for sale has dropped year-over-year for the last 29 consecutive months and is now at a 3.9-month supply.
Existing home sales are currently at an annual pace of 5.48 million, the highest pace since June of this year, but down 0.9% from October 2016.
NAR’s Chief Economist, Lawrence Yun, had this to say: “While the housing market gained a little more momentum last month, sales are still below year ago levels because low inventory is limiting choices for prospective buyers and keeping price growth elevated.”
Each year, most homeowners wait until the spring to sell their houses because they believe that they can get a better deal during the normal spring buyer’s market. However, recently released data suggests that a seller’s best deal may be available right now. The concept of ‘supply & demand’ reveals that the best price for an item will be realized when the supply of that item is low and the demand for that item is high. Let’s see how this applies to the current residential real estate market.
SUPPLY
It is no secret that the supply of homes for sale has been far below the number needed for over a year. A normal market requires six months of housing inventory to meet the demand. The latest report from the National Association of Realtors (NAR) revealed that there is currently only a 4.2-month supply.
Supply is currently very low!!
DEMAND
A report that was just released tells us that demand is very strong. The most recent Foot Traffic Report (which sheds light on the number of buyers out looking at homes) disclosed that there are more buyers right now than at any other time in the last twelve months. This includes more buyers looking at homes right now than at any time during last year’s spring market.
Demand is currently very high!!
Bottom Line
Waiting until the spring to list your house for sale made sense in the past. This year is different. The best deal is probably available right now.
So, you’ve decided to sell your house. You’ve hired a real estate professional to help you with the entire process, and they have asked you what level of access you want to provide to potential buyers.
There are four elements to a quality listing. At the top of the list is Access, followed by Condition, Financing, and Price. There are many levels of access that you can provide to your agent so that he or she can show your home.
Here are five levels of access that you can give to buyers, along with a brief description:
Lockbox on the Door – this allows buyers the ability to see the home as soon as they are aware of the listing, or at their convenience.
Providing a Key to the Home – although the buyer’s agent may need to stop by an office to pick up the key, there is little delay in being able to show the home.
Open Access with a Phone Call – the seller allows showings with just a phone call’s notice.
By Appointment Only (example: 48-Hour Notice) – Many buyers who are relocating for a new career or promotion start working in that area prior to purchasing their home. They often like to take advantage of free time during business hours (such as their lunch break) to view potential homes. Because of this, they may not be able to plan their availability far in advance or may be unable to wait 48 hours to see the house.
Limited Access (example: the home is only available on Mondays or Tuesdays at 2pm or for only a couple of hours a day) – This is the most difficult way to be able to show your house to potential buyers.
In a competitive marketplace, access can make or break your ability to get the price you are looking for, or even sell your house at all.
In today’s housing market, where supply is very low and demand is very high, home values are increasing rapidly. Many experts are projecting that home values could appreciate by another 5%+ over the next twelve months. One major challenge in such a market is the bank appraisal.
If prices are surging, it is difficult for appraisers to find adequate, comparable sales (similar houses in the neighborhood that recently closed) to defend the selling price when performing the appraisal for the bank.
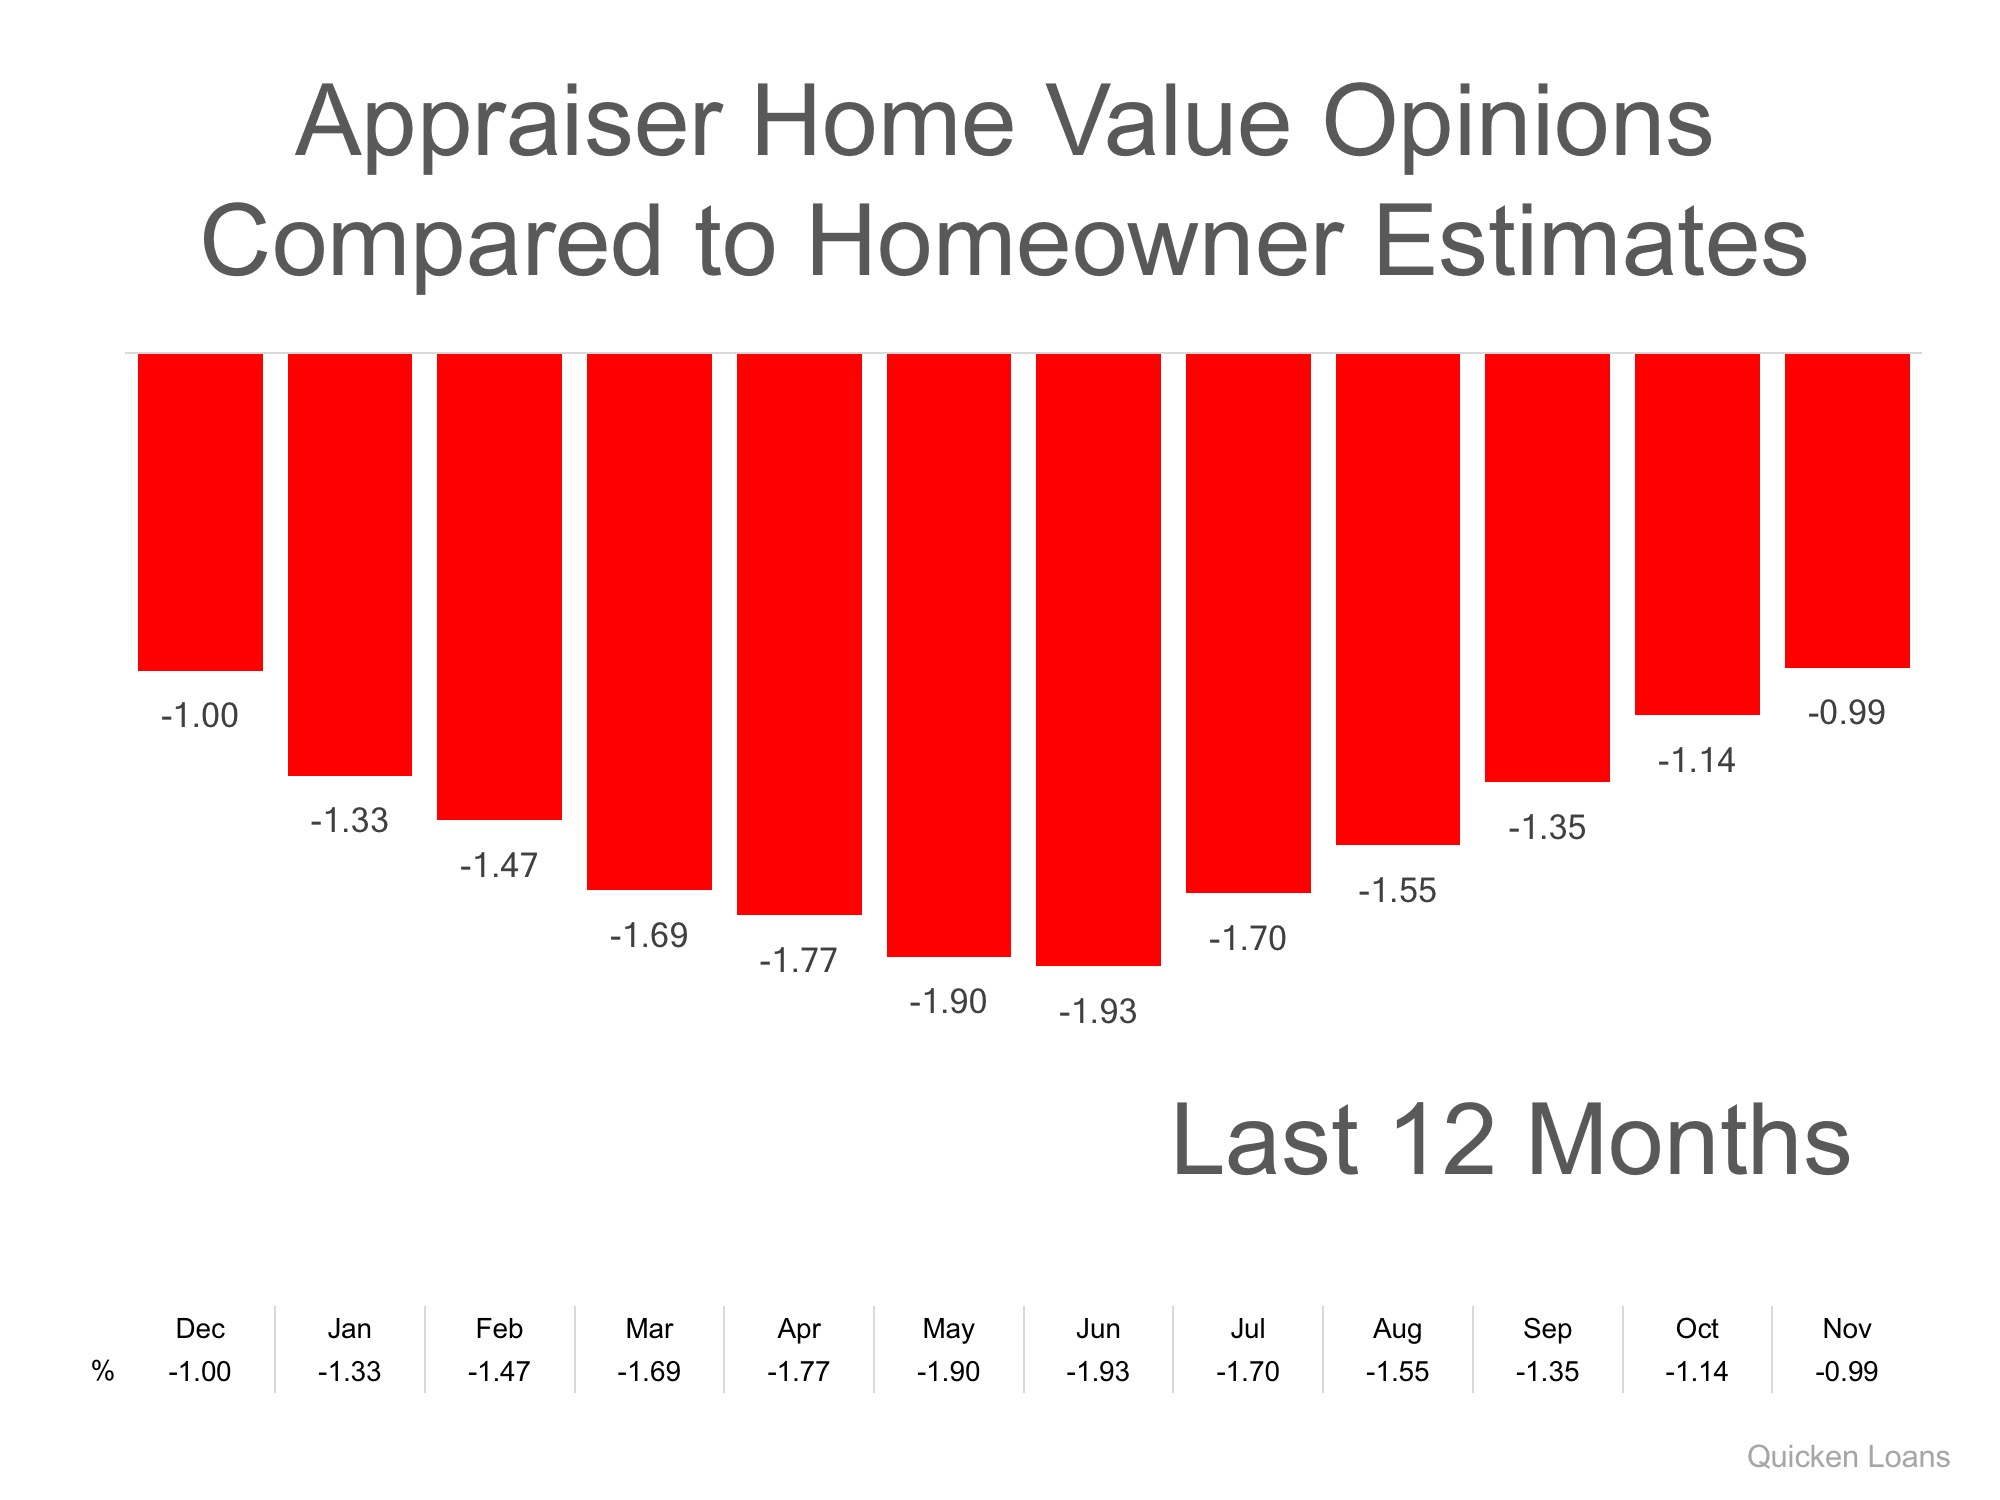
Every month in their Home Price Perception Index (HPPI), Quicken Loans measures the disparity between what a homeowner who is seeking to refinance their home believes their house is worth, and an appraiser’s evaluation of that same home.
Bill Banfield, ExecutiveVP of Capital Markets at Quicken Loans urges anyone looking to buy or sell in today’s market to remember the impact of this challenge:
“Based on the HPPI, it appears homeowners in the markets where prices are rising faster than the national average – like Denver, Seattle and San Francisco – are continuing to underestimate just how quickly home values are rising, so the average appraisal is higher than homeowner estimate.
On the inverse of that, homeowners in areas where the values aren’t rising as fast may think they are rising faster than they are, leading to the appraisal lagging the estimate.”
The chart below illustrates the changes in home price estimates over the last 12 months.
Bottom Line
Every house on the market must be sold twice; once to a prospective buyer and then to the bank (through the bank’s appraisal). With escalating prices, the second sale might be even more difficult than the first. If you are planning on entering the housing market this year, let’s get together to discuss this and any other obstacles that may arise.


![Median Days on the Market Drops to 34! [INFOGRAPHIC] | MyKCM](https://d8yi0qr1xsq5x.cloudfront.net/2017/11/30154843/20171201-Days-on-the-Market-STM-1046x1354.jpg)



![Existing Home Sales Slowed by a Lack of Listings [INFOGRAPHIC] | Simplifying The Market](https://d8yi0qr1xsq5x.cloudfront.net/2017/11/22152203/20171124-EHS-Report-STM-1046x1354.jpg)